At Pismo, we have an entire platform made up of microservices that fits in remarkably well with the modular nature of our business, in addition to providing flexibility for the rapid expansion of new demands that arise in the financial services market.
New engineers join the company every fortnight, and we create new services and products frequently. Moreover, we often design new squads and tribes to support and maintain the increasing demands related to this exponential growth.
This continuing expansion of our software ecosystem increased the platform’s architectural complexity and brought several challenges for the engineers and architects. We can summarise some of these difficulties in the following question:
“In a globally distributed dynamic environment, how do we deal with the well-known microservices hardships such as availability, reliability, maintainability, performance, security, and testability?”
Discussing how to handle this challenge, we came up with a scalable approach that would guarantee cohesion between the different services we have without reducing the autonomy of our teams.
Listing the microservices
We realised that we would need an application listing all services with their respective owners. This application should contain detailed information about each microservice, including the programming languages utilised to develop it, the database it accesses, the message broker, the queues it uses and any relevant stack information.
We chose Cortex to build our monitoring system from among the various tools available to observe microservices. It proved to be a robust tool that met our needs, and it is being continually updated with new features.
With the microservices database we built on Cortex, we can answer questions such as “Which programming languages do we use most?” or “What is the SLA level of our message brokers?” We can even identify specialists in each technology used in the company since their names are connected to the microservices in which they worked.
This information allowed us to picture the configuration of our ecosystem. But it was not enough to guarantee the quality standards we wanted for our microservices. So the next step was to elaborate a system to automatically evaluate those services in terms of adherence to architectural standards and development best practices.
The microservices catalogue
Most of the additional information we needed to confirm the architectural fitness of the microservices was already available. It was generated by the tools we used for code versioning, observability, code quality evaluation, and even our cloud providers’ services. So we decided to use the same application to collect data from these systems and aggregate it.
Going further, if we could use this information to perform validations and automatically assign scores to services, we would have visibility into the current state of our ecosystem and provide ongoing insights for squads to carry out technical improvements in their services autonomously.
After all the debates regarding exponential growth, service quality, and architectural complexity, it was clear that we needed a robust microservices catalogue. That would allow us to describe, evaluate and monitor the health of our services.
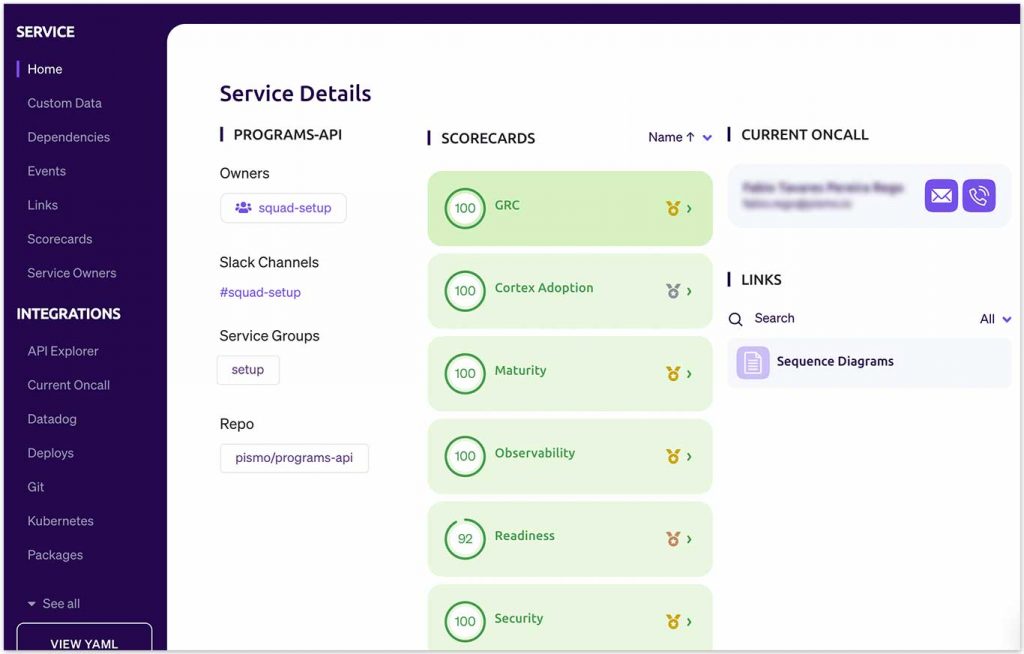
To build the catalogue, we generated a profile page for each service with various dimensions, such as ownership, documentation, maturity level, production readiness, on-call squad members, code quality, and security, see figure 1. We also configured automated notifications on Slack congratulating the developers for the improvements and warning them about points that required their attention.
We created grades from 0 to 100 by applying the concept of scorecards, a set of boolean assertions that compare data captured from operating software with the levels desired by our architects and engineers.
The possibilities for creating rules are numerous. For example, one of the rules we can use to assess whether a service is ready to go to production is k8s.replicas.desired.count >= 3. This simple rule checks if the number of replicas of that service is at least three.
Or we can have a rule that checks if the documentation file is in the correct path of the repository: git.fileContents(“docs/openapi.yaml”). Each rule has a relative weight in the scorecard, and their combination provides a final grade to the service.
Making dependencies visible
Scorecards allow our teams to assess our microservices’ production readiness and development quality. These factors are automatically evaluated, allowing for continuous monitoring of the health and quality of services.
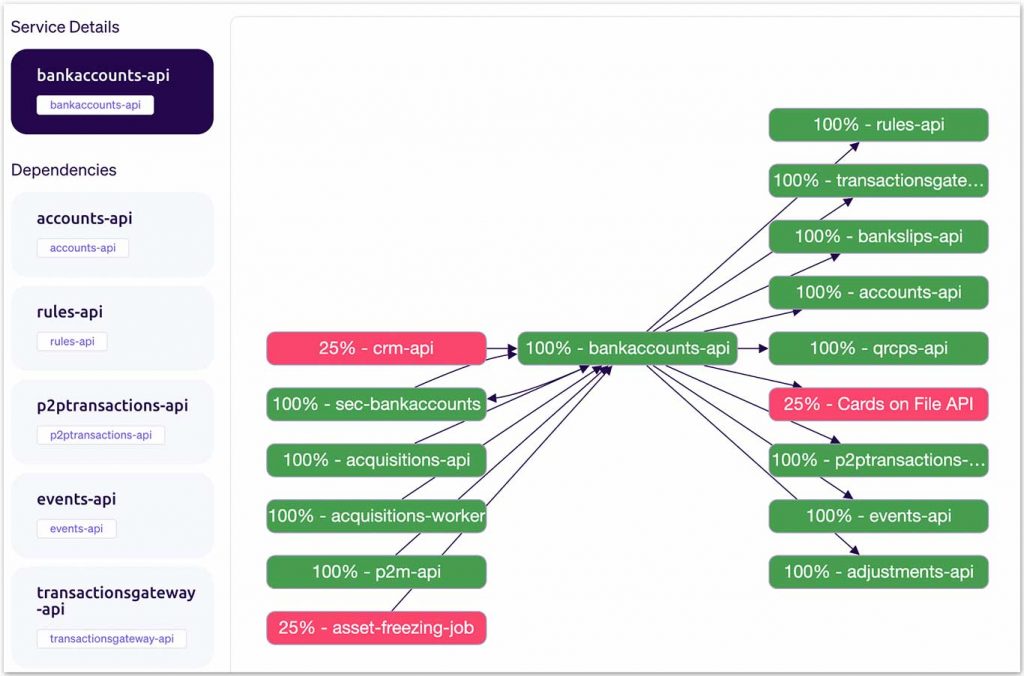
Moreover, we decided it would be relevant to list the relationships between those microservices. Hence we built a dependency graph of our ecosystem, identifying possible bottlenecks, service interfaces, and the most requested services. Additionally, we could plot the maturity levels and understand our ecosystem’s critical contexts, as shown in figure 2a.
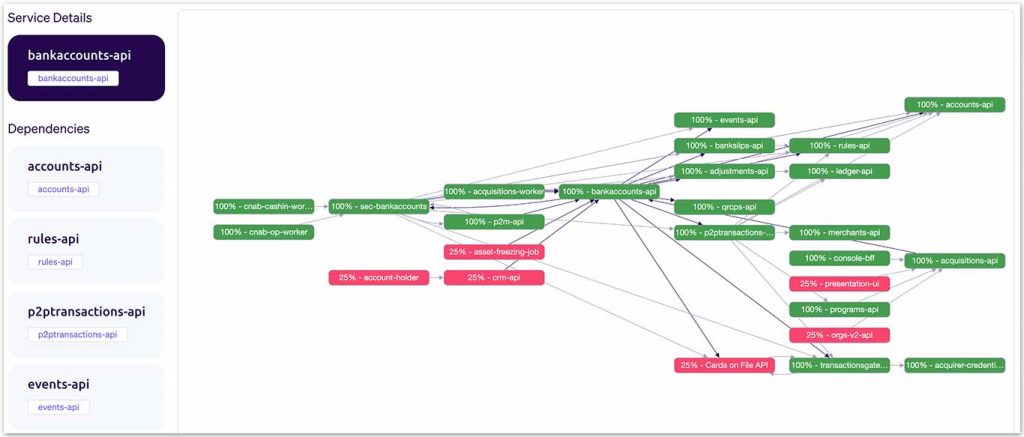
Another feature that we implemented was making the indirect dependencies visible. We wanted to observe the various levels of dependency between our microservices. Thus it would be easier to evaluate critical data flows to compose better behaviour specifications and service choreographies. We can see an example of this comprehensive view in figure 2b.
Combining scorecards with dependency graphs allows us to identify where we should prioritise our efforts to improve our services and, consequently, the whole Pismo banking and payments platform. So our squads have a tool that helps them in the decision-making process, providing a basis for choosing backlog activities for the next sprints.
How to build a catalogue
What is the level of effort to catalogue all these services? Incredibly, the only thing we needed to do to have all this visibility at the service level was to add a YAML file with OpenAPI specs to our service’s repository on GitHub.
Then a GitHub app sends a webhook to Cortex to verify the integrations and automatically populate the information. Asynchronously, the scorecards created by our software architects are evaluated in an automated way.
We are currently on the way to having around 200 services in production. Even with all the day-to-day demands, our squads have managed to catalogue their services in just a few weeks. From that first day when we started the tool configuration until the moment we catalogued the last service, we had gone from a low visibility scenario to robust and scalable visibility of our entire ecosystem in just two months.
Dynamic reports and gamification
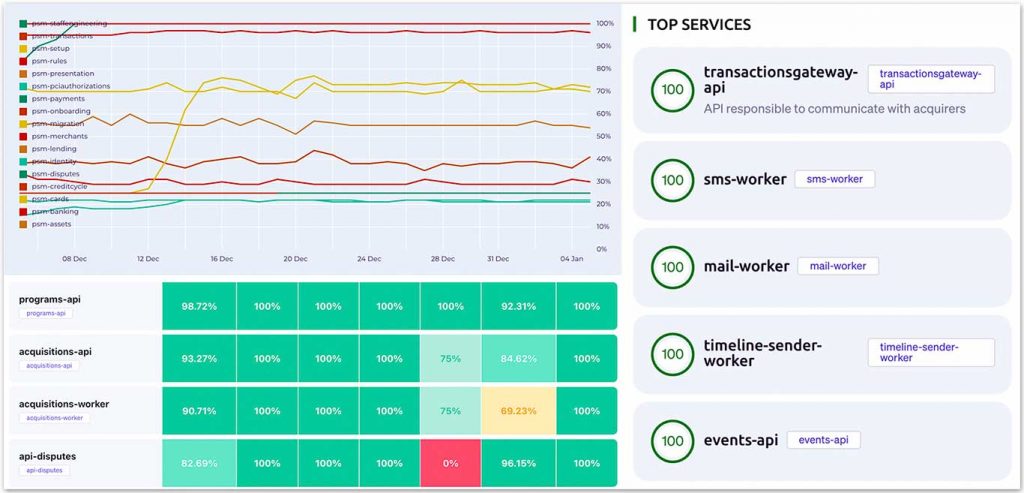
Another vital aspect for ensuring the adoption of architectural standards is the automated monitoring of services through dynamic reports. These reports allow us to keep a check on whether the service is adhering to the standards, even with frequent changes, through progress charts and heatmaps.
Furthermore, the automated monitoring approach opens the road to implementing gamification processes. We can define maturity levels and reward the services with badges and trophies when they are compliant with the predefined standards.
Finally, we can establish squads and services ranks, making monitoring the services’ progress effective and pleasurable. See figures 3a, 3b, and 3c.
Next steps
We are now planning to implement more complex rules and scorecards related to anti-patterns evaluation, business rules, chaos experiments, and security aspects. The plan is to establish a framework so that all our engineers can propose new rules and integrations. Hence we will continue to favour standardisation in scale with minimal impact on the autonomy of our squads.
—
I thank the Cortex team for their availability and insights. We have established an incredible partnership with them.


